THE CHALLENGE
Where teams get stuck
- Teams spend time reconciling reports from multiple systems.
- Metric definitions can differ between departments.
Real-time KPI monitoring and business reporting.
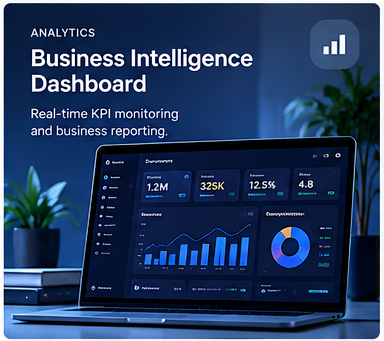
Illustrative interface concept. Features and technologies shown are proposed, not a claim of a delivered implementation.
OVERVIEW
A reporting concept that brings selected business metrics into one consistent, readable management view.
THE CHALLENGE
OUR SOLUTION
KEY FEATURES
Highlight important measures.
Explore changes over time.
Focus on teams or periods.
Share consistent summaries.
PROPOSED TECHNOLOGY STACK
These technologies are suitable options to evaluate during discovery. The final stack depends on requirements and existing systems.
POTENTIAL BUSINESS BENEFITS
RELATED USE CASES

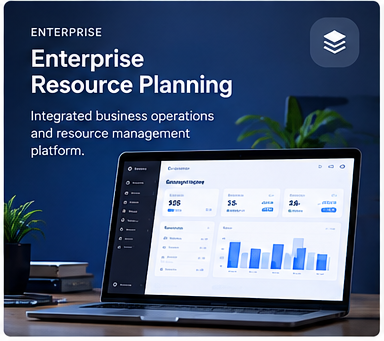
Integrated business operations and resource management platform.
Explore Solution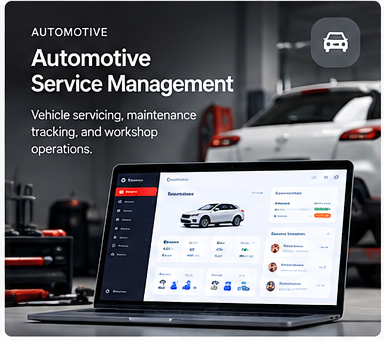
Vehicle servicing, maintenance tracking, and workshop operations.
Explore SolutionLET'S BUILD TOGETHER
Let's discuss how we can transform your business challenges into digital solutions.